Land Cover
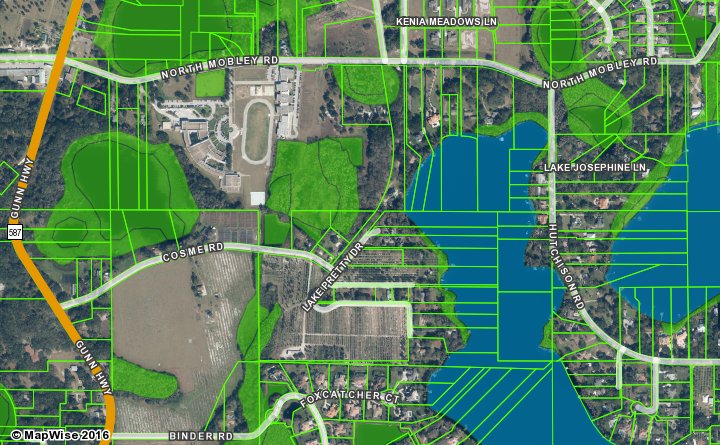
Land Cover information describes the predominant physical and cultural features that make up our landscape. Land cover is mapped from aerial photos and represented by polygons that define areas of land cover types. A hierarchical classification system groups similar types of land cover.
Use land cover information to:
- Analyze growth patterns.
- Determine wetland locations and types.
- Evaluate potential wetlands losses or impacts.
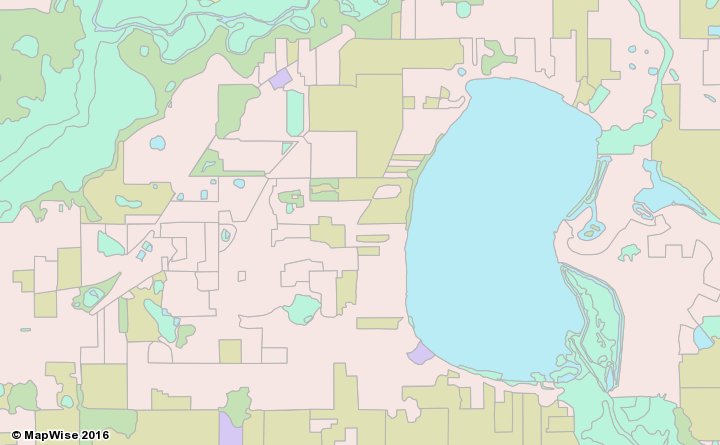
Land Cover 2023
Wetlands 2023
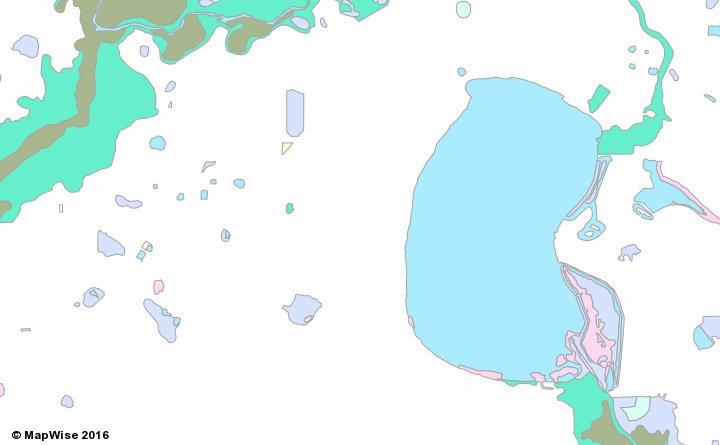
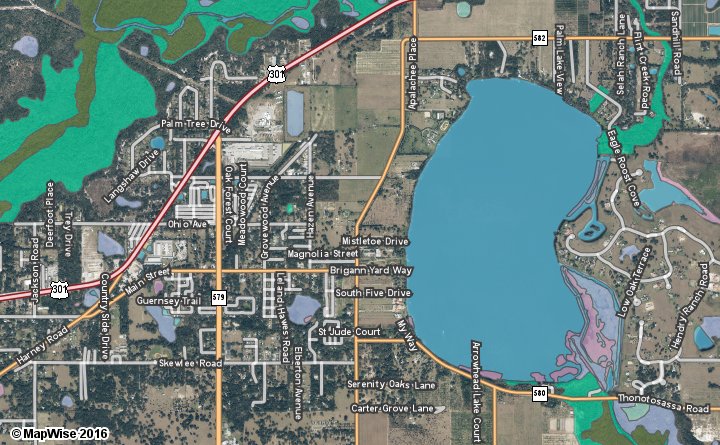
National Wetlands Inventory
How to Access Land Cover Map Layers
Use the MapWise GIS Map Viewer to explore land cover maps and related information.
- Built for real estate professionals.
- Covers the state of Florida.
- 7-Day Free Trial
- Pricing Info